The Social Design Project course is taking place during the second trimester of 2020. Due to the Covid-19 pandemic, classes are offered online on Zoom for the first time. The article below provides a summary of the lectures given on Week 2 by Dr Giorgio Salani. These were attended by about 45 students, who also participated in online group exercises and completed a formal assignment at the end of the week. A description of Week 3 classes can be found here.
In line with Prof. Nohara’s working definition of Social Design as “planning and presenting services or products that contribute to our society”, Dr Salani discussed the delivery of ‘value’ through technical and design work. Week 2 classes focused on “delivering value to clients” through consultancy services, and Week 3 on “creating original value” through research. Effectively, these were used as contexts to introduce basic notions of Engineering Consultancy in Week 2 and Design Research in Week 3. Dr Salani’s professional background in both fields offered direct insights into real projects, merging theoretical explanations with practical considerations.
An Introduction to Engineering Consultancy
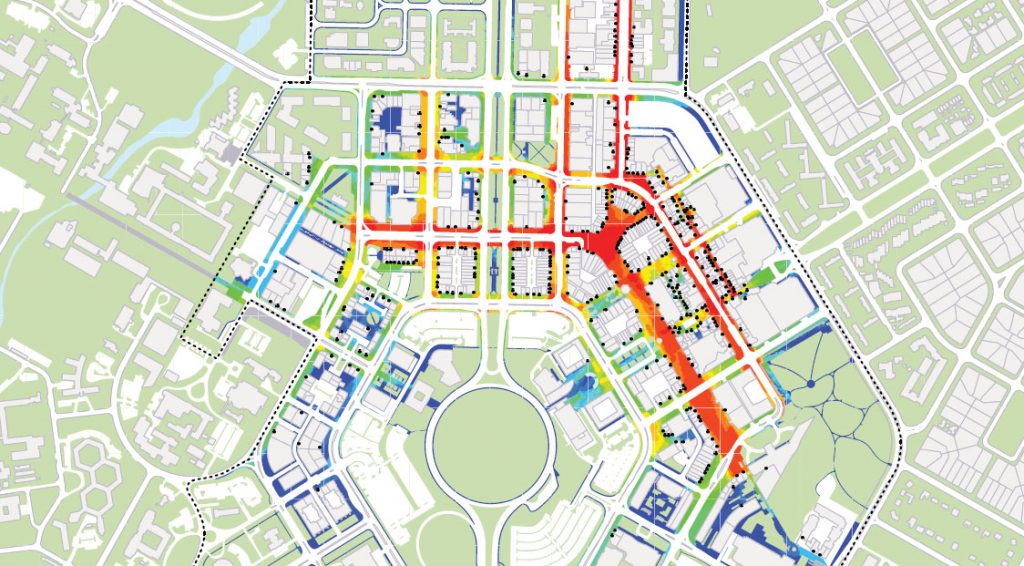
The class started with a description of Visibility Graph Analysis (VGA), a method of quantitative assessment of urban spaces that was initially developed in the late 1990s and quickly grew into an industry standard. VGA provides clients with measures of visibility and accessibility that can be used to directly compare the performance of proposed plans and masterplans during initial design stages. Results can also input into predictive pedestrian models to simulate the traffic expected to occur in a variety of scenarios. This is a powerful tool for transport engineers – worth discussing in its own right – but in the lecture Dr Salani primarily used it to illustrate the work of Engineering Consultants. The VGA software Fathom was developed by Intelligent Space Partnership in the UK in the early 2000s, and initially offered as a software package to architects and urban planners. Failing to attract sufficient interest, the founders began to use the software to provide evidence-based professional advice to their clients, and so the company flourished as a consultancy. A typical business success story, the company quickly grew to employ 25 staffs and was later acquired by a major engineering corporation, Atkins Ltd, itself recently bought out by the SNC-Lavalin group.
So, what is consulting? Consultants are professionals who make their expertise available to clients (Williams and Woodward, 1994). They offer technical assistance and professional advice, e.g. in the form of policy recommendations, data analysis or design work. Often working on multiple projects at the same time, they operate in a corporate environment that is highly regulated by company procedures and industry standards. The lecture discussed typical roles and responsibilities shared by a team of consultants, highlighting the need for teamwork and multidisciplinarity. Accounts from Dr Salani’s professional experience illustrated approaches and real-life conditions in which engineering consultants operate.
The Skills of an Engineering Consultant
The “1+7 model” offered by Williams and Woodward (1994) was adapted to show the multiple roles a consultant is expected to play when undertaking a project. This goes well beyond the goal of providing specialist information and advice as an expert in a particular field, and involves the multiple roles shown in the figure below.
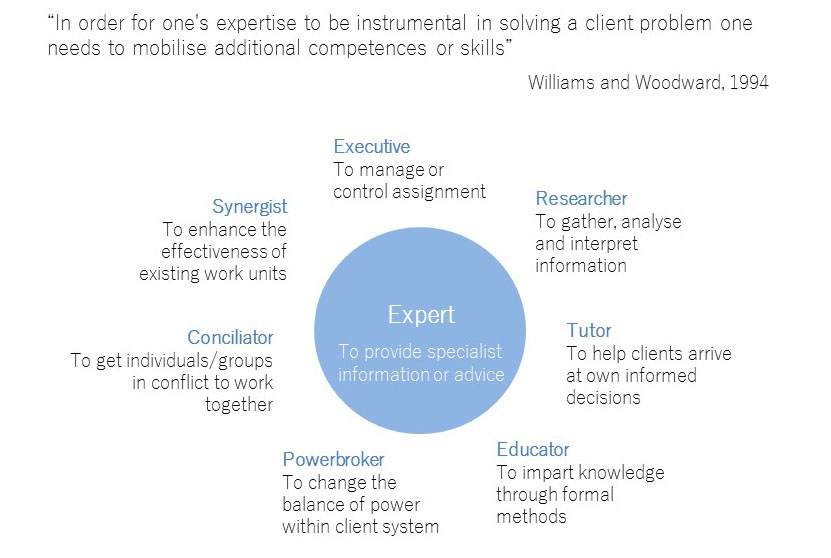
The focus here was on the non-technical nature of these important roles. A goal of the lecture was to emphasise the need for additional skills required by engineers and technical specialists. To further illustrate this point, a recent, real profile of a software engineer from an online recruiting ad was discussed in the class, highlighting several competencies expected from a graduate applying for the position. Besides a comprehensive understanding of the profession, the employers listed skills and attitudes that included the ability to manage time, space and power constraints, being confident and responding positively in stressful situations, interacting constructively with customers and colleagues, being able to provide creative solutions, and generally demonstrating excellent communication skills. Interestingly, the assignment completed by the students after the class showed these requirements resonated with the students’ needs to prepare for a professional career. Many expressed the desire to develop further communication skills during the course of their studies. As explained in the lecture, this is seen as key to enable the implementation and application of the more strictly technical expertise acquired at university.
At the end of the first lecture, students completed concept maps of non-technical consultancy competencies. The exercise invited them to reflect on the knowledge, skills and attitudes required by employers in work that involves – among other activities – direct contact with clients and communication with diverse audiences.
The Consulting Process
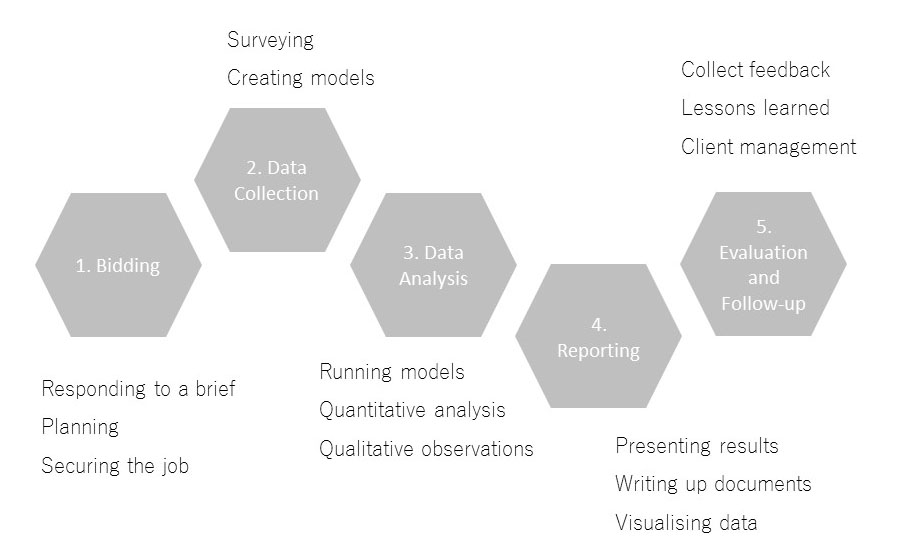
The second part of the class went deeper into the analysis of the engineering consulting process. Theoretical diagrams and definitions of the various stages involved in delivering services to clients were illustrated by a real case study: a transport assessment undertaken by Dr Salani for the Royal Parks (client) in London, UK, in 2014. The purpose of the project was to monitor the use by pedestrians and cyclists of a shared path located within an important public green space in central London. This aimed at identifying current flow levels, conflicts and interactions between transport modes to provide a baseline analysis before the installation of cycle speed calming measures along the route. The project exemplified a typical transport engineering service whereby consultants provide specialist advice to a client, informed by the collection and analysis of new data. The project included an initial scoping study, surveys conducted by the consultancy team and CCTV surveys commissioned to sub-contractors. Using the project as a context for discussion, the students were introduced to key phases in engineering consulting work, which are summarised in the diagram below.
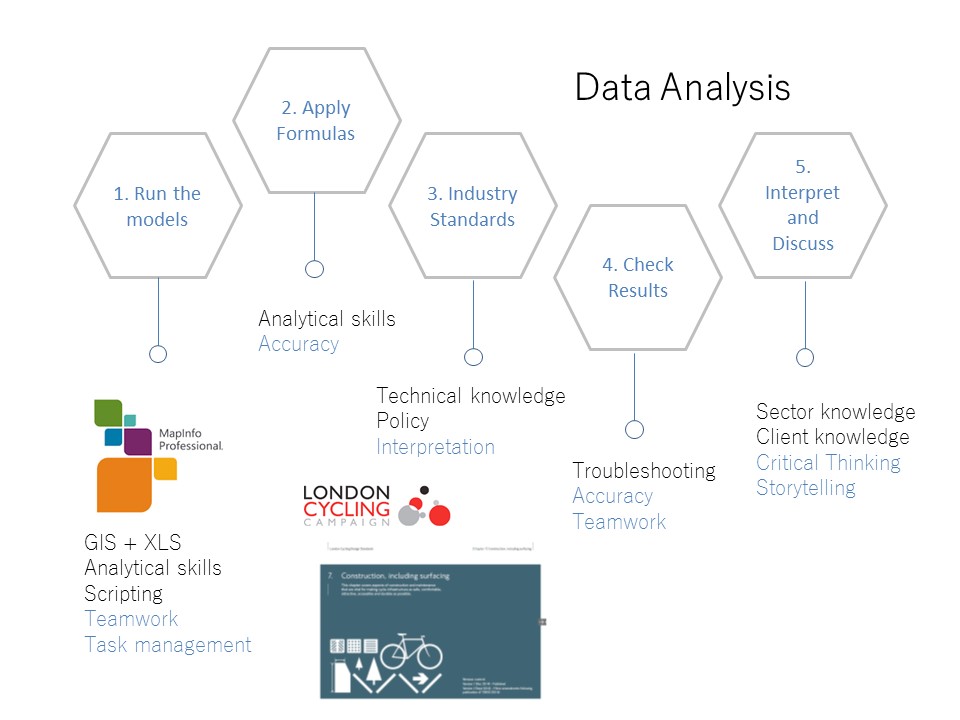
An account of the tasks involved in delivering the project for the Royal Parks provided context to describe not only the tasks involved but to highlight the technical and non-technical competencies involved at each stage. This illustrated the content of the first lecture with a practical example of the application of the characteristics discussed in the group exercise. The example of the Data Analysis phase is shown in the figure below. Negotiation, communication and critical skills play an even more central role in the last phase of a consultancy project, the Evaluation phase. The diplomacy and reliability of consultants is put to the test in this final stage, in which the project is internally evaluated to identify mistakes and lessons to inform future procedures. This can also be a period of more intense communication with clients to acquire – or at least test the waters for – project extensions.
Delivering Value
In his seminal book Design for the Real World (1972), design theorist Victor Papanek tells the story of his young self in New York in the 1950s, invited by his new employer to describe his role as a designer in the factory. Discussing his work on a new model of transistor radio, Papanek mentioned the “beauty” of the product at the market level and the “consumer satisfaction” created by his original design. His boss interrupted him and reminded him instead of his main responsibility as a designer to create something that could be produced and sold to support the company’s stakeholders and all the workers that would flock from various parts of the US to find employment in the factory and produce his radio. Later on in his life, Papanek realised the designer has also additional responsibilities, not just towards customers and workers, but society and the environment. This simple tale set the basis for the discussion on delivering value through consultancy work, not just to clients but to society at large.
The model to assess the impact of consultancy work was developed for this course based on the 7-point radial charts utilised by Prof. Nohara in her Week 1 lectures. For Week 2, this was adapted to include the characteristics listed in the diagram below.
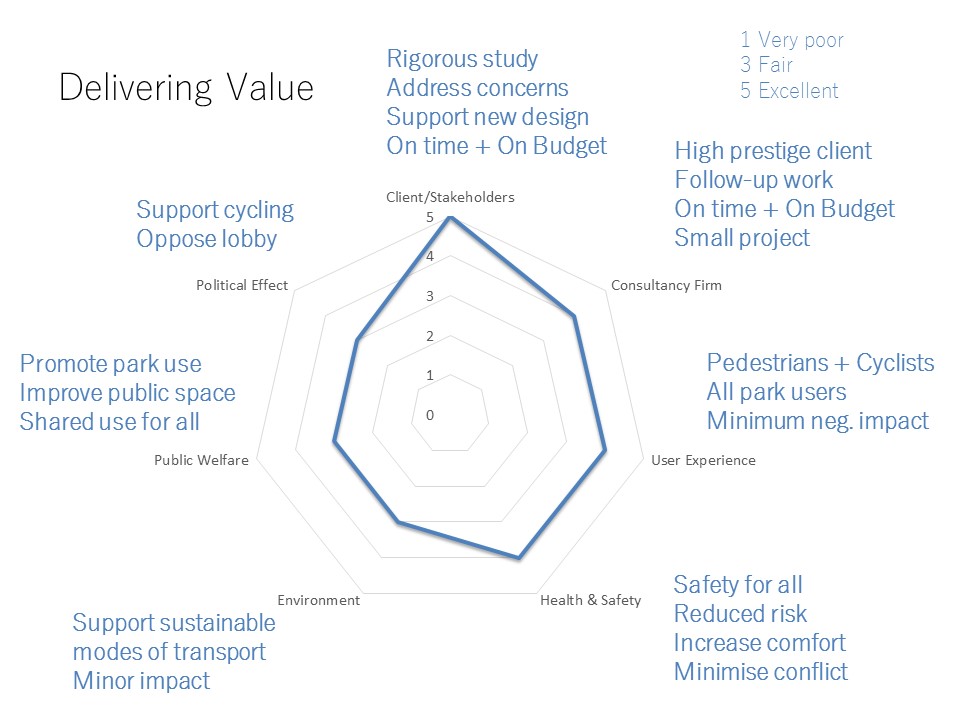
A final qualitative assessment of the project introduced the end of the lecture. A few concluding considerations summarised the impact of the project on various stakeholders (i.e. client, consultants, local community) and broader categories (i.e. health & safety, environment, politics). The visualisation clearly identified the project to be mostly beneficial to those directly involved in undertaking it (client and consultancy firm) and the users of the proposed solutions (the local community of pedestrians and cyclists in the park), particularly in terms of increased safety. A lower impact was identified on public welfare, politics and the environment. Although beneficial, the effect on these was considered of minor importance. This qualitative assessment provided a final review of the lecture and its relevance to the theme of Social Design discussed in the course. The standard format of the 7-point spider map used in the evaluation offered a direct comparison with those discussed in other weeks, offering an additional binder among the classes given by the various lectures, week after week.
The participation in the classes, group exercises and the completion of the assignments on Google Forms showed a notable interest in the topics among the students, and the classes greatly benefited from their active participation. The smooth delivery of the class was made possible by the help of teaching assistants Purevsuren Norovsambuu (Nasso) and Dolgormaa Banzragch (Banzai), and the professional translation support provided by Takumi Saito over the entire lecture. In addition to introducing specific topics, Week 2 classes provided students with methods and food for thought for the Social Design Project course.
Read this blog on Dr Salani’s Week 3 classes on Delivering Original Value.
References
Atkins, 2009 Spatial Analysis of Pedestrian Movement for the Royal Borough of Kensington and Chelsea. Report.
Atkins, 2015a Kensington Gardens, Mount Walk. Cycle and Monitoring Study for The Royal Parks. Final report R3.
Atkins, 2015b Adelaide Riverbank Precint, Pedestrian Modelling Assessment. Report.
Betancur, J. 2017 The Art of Design Thinking: Make more of your Design Thinking workshops.
Chau, Hing-Wah & Newton, Clare & Woo, Catherine & Ma, Nan & Wang, Jiayi & Aye, Lu. 2018. Design Lessons from Three Australian Dementia Support Facilities Buildings.
Grace, R. 1997 The `chaîne opératoire approach to lithic analysis, Internet Archaeology 2
IDEO, 2015 The Field Guide to Human-Centered Design.
IDEO, What is Social Design? Video Available at:
Papanek, V. 1972 Design for the Real World
Plattner, H. 2018 Design Thinking Bootleg. D.School Stanford.
Stickdorn et al. 2011 This is Service Design Thinking
Williams, A.P.O., Woodward, S. 1994 The Competitive Consultant, A Client-Oriented Approach for Achieving Superior Performance. The MacMillan Press. The Royal Parks 2020 Movement Strategy. Report.